Mapping with Meshtastic
This page summarizes one method to create geographic plots of your Meshtastic node range tests. Using this method you can create heat maps which help visualize the strength and signal between any two participating nodes.
Range Test Module

The Meshtastic application includes a range test module which can be used to generate data sets, plotting the distance, location, and signal strength between any two nodes. These may then be plotted on various mapping services, the most ubiquitous being Google, which is what we’ll use here.
We will be making use of two nodes configured with a single base station and a single mobile node. We put the base station into a “Lighthouse” mode where it beacons out every so many seconds. Meanwhiel, our mobile node will be our receiver and its location will be used as the source of our mapped GPS coordinates.
- Enable sharing phone GPS to mesh. I recommend this for range testing, even if you have on-board GPS.
- Connect to Stationary Node, enable range test mode. If walking, set 30s, if driving, set 120s.
- Connect to Mobile Node, optionally clear debug log to start a fresh data file (all existing logs will be lost!).
- Enable Range Test mode, do not set a send time, we will only be receiving.
- Soon, you should see messages appear on your mobile node, like
seq00, incrementing with each ping. - Start walking! Or driving, or hiking, or biking, or flying! Keep watching your mobile client for missed pings. Continue moving until you’re sure you’ve missed a number of pings and have truly lost link with the base station.
- Continue to map the periphery of your connectivity with the base station. Make your path a route you don’t mind repeating, since you may wish to run successive tests to compare performance under different conditions. Make it a reasonable effort not annoying to have to repeat.
- Consider whether you’re losing signal due to range, or line of sight. Line of sight may clear up if you keep moving, but range fades over distance.
- When satisfied with your data set, return to home base. Disable Range Test mode in BOTH the mobile base station and client nodes.
- Disable sharing your phone’s GPS to mesh.
Ensure you disable Range Test mode when not actively in-use. Not only is it a drain on the battery of the participating nodes, even though the broadcasts have a zero hop kill-switch, and are ignored by non-participating nodes, the packets are still processed by the mesh and therefore have the capacity to spam the mesh. It’s absolutely fine to use responsibly, when and as needed, just remember to turn it off when done!
Saving the Data
Now you need to connect to the mobile radio node and export/save the rangetest.csv file. This will save to the local storage of your mobile device. Next, trasfer the rangetest.csv file off the phone and onto a device of your choice…presuming you don’t want to work with it on a phone’s UI. I don’t want to work with it on a phone’s UI.
Use something like a messenger app, or even email. The CSV files are relatively small, especially if you clear the debug log prior to starting your range test. Send it to yourself through whatever means necessary, and save the file on the device of your choice.
Google Sheets: Ingesting the Data Set
Now we create a new sheet in Google Sheets. This is only temporary, so name it anything you like.
- From the file menu, chose Import and browse your local storage to the
rangetest.csvfile. - Accept defaults and Google Sheets will import the file.
- Click on the payload column, chose Create Filter.
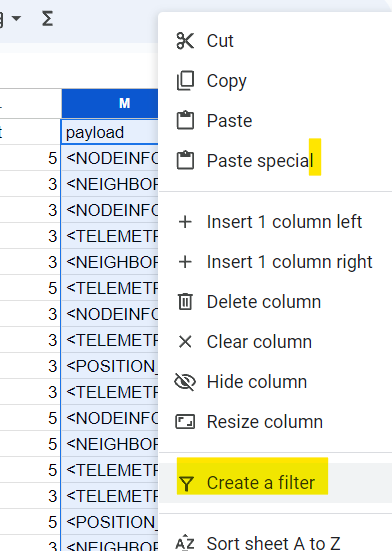
- From the filter menu, clear all selected items.
- Enter:
seqin the search field and then click Select All.’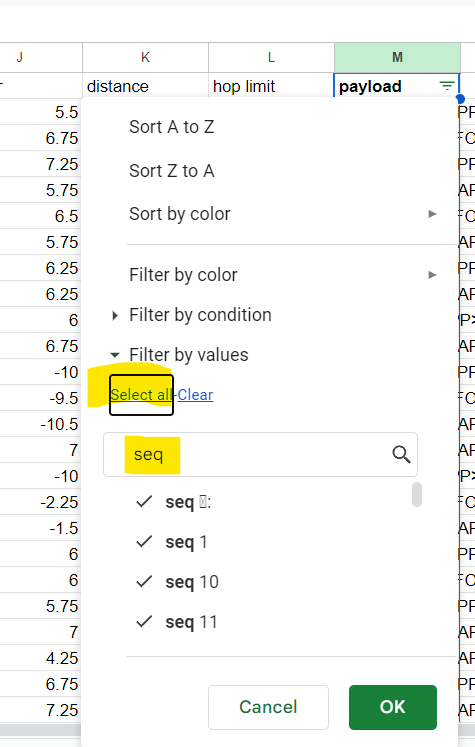
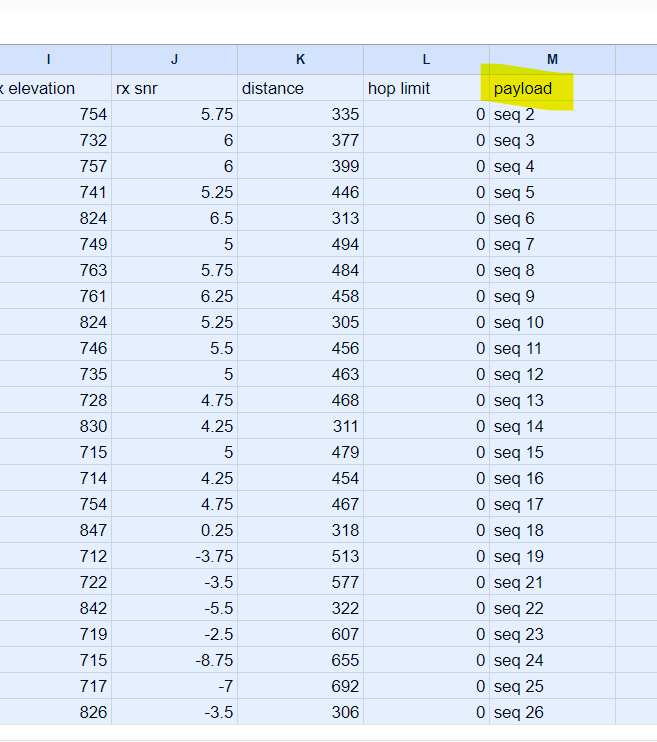
- Your spreadsheet will now only display rows with the seq prefix in the payload column. These are your range test pings. Note you should see Rx SNR, Rx Lat, & RX Long for each packet received.
- Ctrl+A (Cmd+A on Mac) to select all, then Ctrl+C (Cmd+C on Mac) to copy the whole sheet to clipboard.
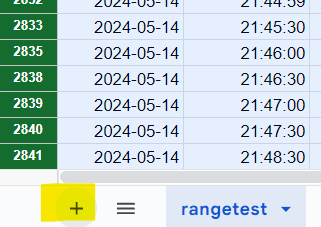
- Click the plus icon at the bottom to add a new sheet, enter the new sheet and Ctrl+V (Cmd+V on Mac) to paste the range test rows to the new sheet.
- Now delete the original sheet, leaving just the sheet containing the filtered range test packets and nothing else.
Google’s My Maps
- Start a new map in Google’s My Maps, or open an existing map to add data to it.
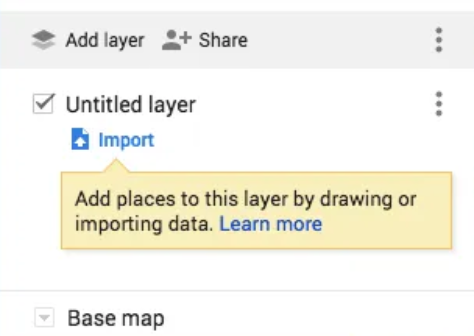
- Import data into the layer, selecting the Sheet we just created in Google Drive.
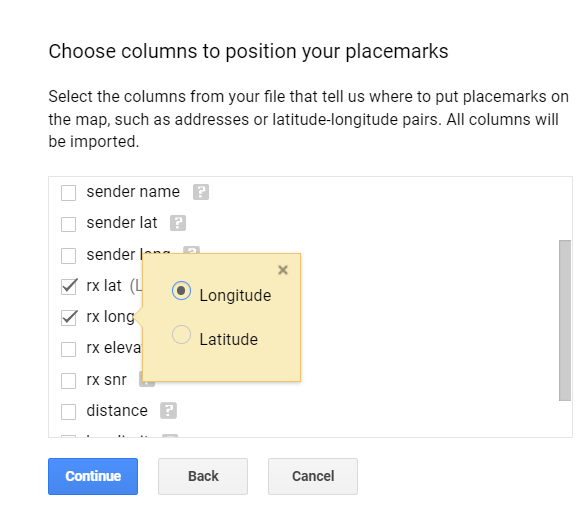
- Google Maps will ask you which columns are to be used to represent latitude and longitude. Fortunately, this is easy as the columns are RxLat and RxLon.
- Google Maps next asks which column to use to name the mapped points. For this, chose Rx SNR.
- Your mapped range test points are now displayed, but we are not done yet!
- Click the paint roller icon and change Group Places By and Set Labels both to Rx SNR.
- Click the radio button next to Ranges and set a sensible number. I use 8, but experiment and see what works.
- Set a color scheme of your choice.
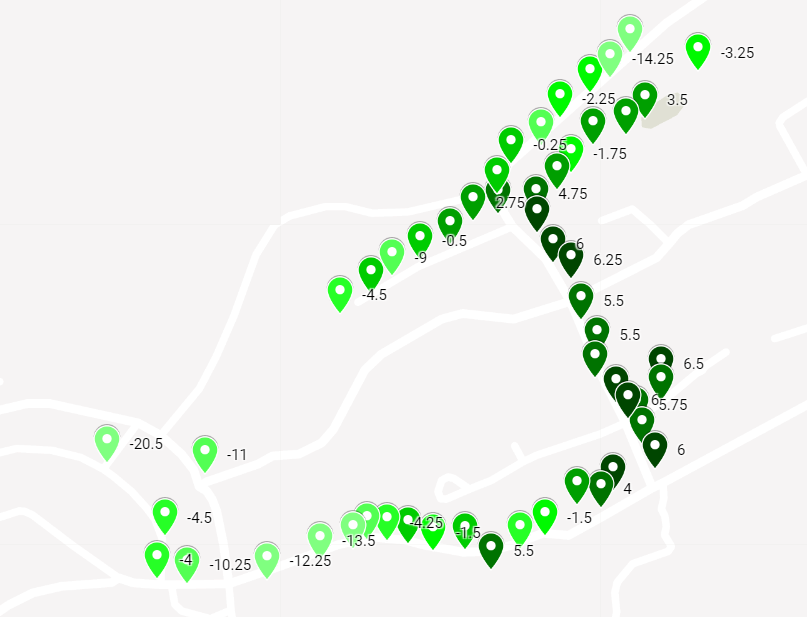
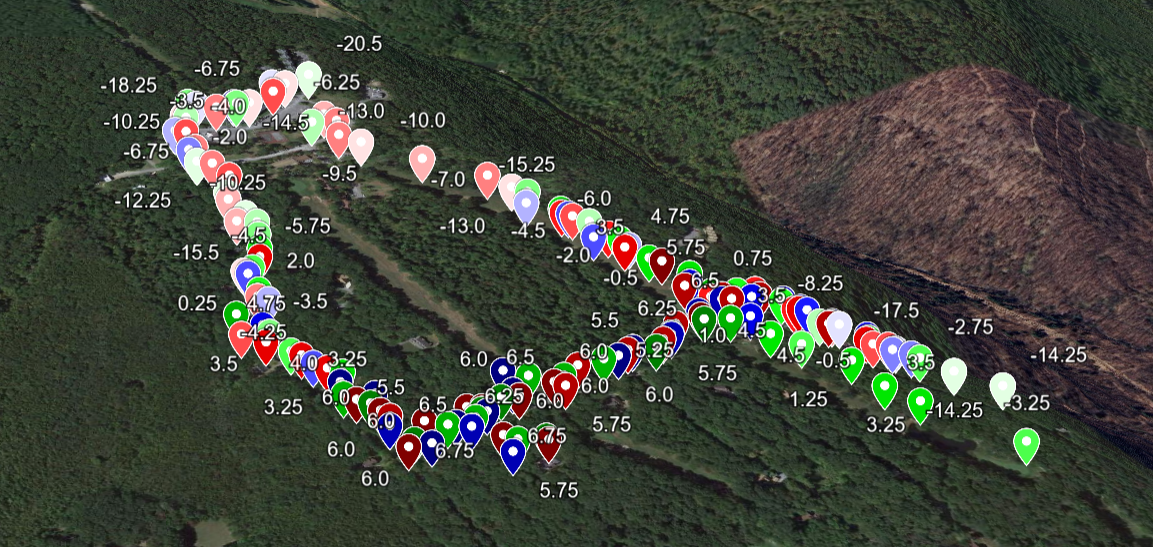
Now you will have a color coded set of plots, each representing a single ping packet sent from your base station to your mobile node during the range test. The color gradient represents the SNR as calculated by the mobile receiver node.
You may now repeat this same test any number of times. By changing a variable each time and comparing to your previous data-sets, you can make informed, objective decisions as to whether any changes have been beneficial or not.
Back to Baseline

Before you can determine whether any changes you make to your mesh are worthwhile, you must first establish a baseline. You can’t know where you’re going if you don’t know where you are. Fortunately, this method is an easy way to establish that baseline. With an adequate baseline, you may make objective determinations about whether any changes are good or bad.
Was that fancy new antenna actually worth it or not? Would it help to move that base station up another three feet?(Yes…the answer is yes)
Now you can answer that question definitively and objectively, using empirical data.
Google Earth
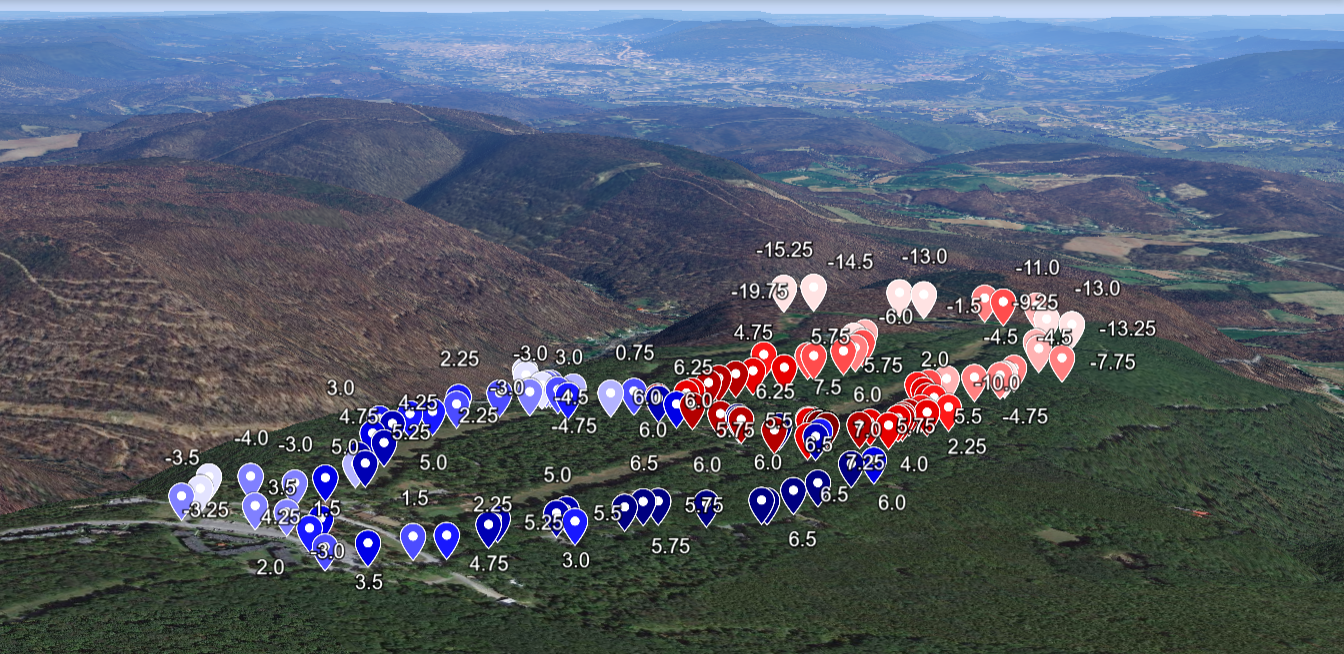 From within the Google My Maps interface, you may open the same map inside of the web version of Google Earth or even export your map in a number of formats. Using Google Earth, you can do some really interesting analysis and visualizations in 3D virtual space.
Got any interesting maps worth sharing? Send me a copy, and I’ll be glad to feature interesting maps here! Happy Mapping!